Most businesses either skip the calculation entirely or run it on incomplete data. They get a development quote, estimate some labor savings, and call it good. The result is a number that looks compelling on a slide deck but collapses under CFO scrutiny six months into the project.
ROI for custom software is genuinely more complex than a single formula. It requires total cost of ownership (not just build fees), both hard and soft benefit quantification, adoption modeling, and a multi-year view that reflects the actual economic life of the software.
This guide walks through the exact formula, a five-step calculation process, the variables that move the needle most, and the mistakes that produce misleading numbers.
Key Takeaways
- The formula: ROI = ((Total Benefits – Total Cost of Ownership) / Total Cost of Ownership) × 100, measured over 3–5 years
- Benefits split into hard ROI (labor savings, license elimination, revenue uplift) and soft ROI (faster decisions, better adoption, competitive positioning)
- TCO goes beyond development fees — infrastructure, maintenance, training, and change management all count
- Year-1 ROI is often negative — that's normal; the real value is in multi-year returns
- Custom software ROI is strongest when workflows are complex, SaaS costs scale with growth, or integration debt creates measurable drag
Understanding the ROI Formula for Custom Enterprise Software
The Core Formula
ROI = ((Total Benefits – Total Investment) / Total Investment) × 100
Two terms need precise definitions here. "Total Investment" means full TCO — not just the development invoice. "Total Benefits" means all quantifiable financial gains over the measurement period.
Nucleus Research defines technology ROI as average annual net benefit divided by total initial cost, applied over a three-year horizon to account for fluctuations in deployment and benefit realization.
Hard ROI vs. Soft ROI
Hard ROI captures measurable financial impact that shows up directly in financial statements:
- Reduced headcount through automation
- Eliminated SaaS subscription fees
- Faster revenue cycles and reduced billing errors
Soft ROI captures qualitative improvements that influence business outcomes without appearing on a P&L:
- Faster decision-making and reporting
- Employee satisfaction and reduced turnover
- Competitive differentiation in sales cycles
Leaving soft ROI out of your model understates the case for investment. Translate each soft benefit into a proxy financial metric — for example, map improved employee satisfaction to reduced turnover costs using industry replacement cost benchmarks (typically 50–200% of annual salary per role).
The Payback Period Formula
Payback Period = Initial Investment / Annual Net Benefit
A project can show a strong three-year ROI but carry a 30-month payback period that creates real cash flow pressure. CFOs track this number separately from ROI percentage because it signals liquidity risk, not just profitability. Running both metrics gives decision-makers the full picture.
Calculate ROI at two levels:
- Year-1 ROI — CFO-friendly near-term impact (often negative, which is expected)
- Multi-year discounted ROI or NPV — reflects the true economic life of the software, accounting for the time value of money
How to Calculate ROI for Custom Enterprise Software
ROI calculation is a five-step process. Shortcuts at any stage produce numbers that won't survive stakeholder scrutiny.
Step 1: Establish Your Pre-Implementation Baseline
Document the current state before any software is built:
- Total hours spent on manual processes, broken down by role
- Current SaaS and license costs (all of them, including unused seats)
- Error rates and associated rework costs
- Revenue constraints caused by existing tooling limitations
Without this baseline, post-implementation gains can't be accurately attributed to the software. Treat it as a governance requirement, not a best practice. Organizations that skip this step struggle to defend ROI claims to boards or investors.
Step 2: Define and Quantify All Expected Benefits
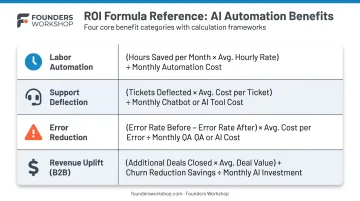
Map every benefit to a dollar value using specific formulas:
| Benefit Category | Formula |
|---|---|
| Labor automation | Hours Saved Per Year × Fully-Loaded Hourly Rate |
| Support deflection | Tickets Deflected × Cost Per Human-Handled Ticket |
| Error reduction | Annual Error Volume × Average Rework Cost Per Error |
| Revenue uplift (B2B) | New Leads × Close Rate Improvement × ACV × Gross Margin % |
For support deflection benchmarks: Gartner reports a median $1.84 cost per contact for self-service channels versus $13.50 for assisted channels like phone and email. That gap is where deflection ROI is calculated.
For error reduction: Gartner estimates poor data quality costs organizations at least $12.9M per year on average — a figure that validates why error-reduction benefits deserve serious quantification in your model.
Step 3: Calculate the Full Total Cost of Ownership (TCO)
TCO has four components:
- Build cost — engineering, design, QA, delivery management, integrations
- Operating costs — hosting, support staffing or vendor retainer, infrastructure licenses
- Enablement costs — training, change management, rollout communications
- Governance and compliance — security audits, penetration testing, legal and privacy costs
Maintenance is the most commonly underestimated line item. Industry estimates put ongoing maintenance at 60–80% of total software lifecycle costs — and for enterprise systems, that number doesn't shrink over time. Budget for it as a fixed line item, not an afterthought.
For Founders Workshop clients, the D5 Dedicated Developer phase (80–160 hours/month post-launch) covers this ongoing support, with structured tiers that keep maintenance costs predictable rather than reactive.
Step 4: Run the Year-1 and Multi-Year ROI Calculations
Using data from Steps 2 and 3:
- Year-1 ROI: (Year-1 Benefits – Year-1 TCO) / Year-1 TCO × 100
- Multi-year ROI: Same formula applied across a 3–5 year window
- NPV (if discount rate is available): Apply the company's hurdle rate to future benefit streams
Year-1 ROI is often negative or low. For a capital investment with a reasonable payback period, that's the expected shape. The number that drives strategic decisions is the multi-year return — and understanding that return requires one more calculation.
Step 5: Calculate the Payback Period and Sensitivity Range
Payback Period = Total Build Investment / Average Annual Net Benefit
Then run three scenarios:
- Conservative: Benefits come in 20% below projection
- Base case: Benefits as projected
- Optimistic: Benefits exceed projection by 15–20%
This range gives decision-makers a realistic band of outcomes and demonstrates the depth of your analysis. A single-number projection rarely survives a serious executive review. A range with documented assumptions almost always does.
Key Variables That Affect Your ROI Calculation
Two organizations building similar software can achieve very different returns depending on how these four variables play out.
Process Automation Scope
Labor cost savings are typically the single largest driver of positive ROI in enterprise software. McKinsey's automation research found that automation technologies can deliver 20% or more in labor savings for large institutions, with productivity growth improvements of 0.8 to 1.4 percentage points annually in modeled scenarios.
To build this into your ROI model:
- Document actual hours per week spent on target processes across all affected roles
- Multiply by fully-loaded cost (salary + benefits + overhead)
- Apply a realistic reduction estimate — a 30% reduction per FTE can generate six-figure annual savings at enterprise scale
User Adoption Rate
Software that employees don't use generates zero ROI — regardless of its technical quality. Apply adoption rate as a multiplier on all projected benefit figures. At 60% adoption, every benefit line in your model should be discounted accordingly.
This is where soft factors like usability and change management have hard financial consequences. Budget for adoption explicitly; don't assume it happens automatically at go-live. And recognize that adoption rate directly amplifies or cancels out whatever labor savings your automation scope projects.
Total Cost of Development
The development investment is the denominator in the ROI formula — reducing it improves ROI directly. This is where delivery model matters most.
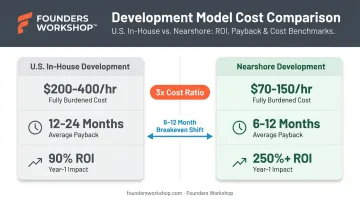
For context, the BLS reports the median annual wage for U.S. software developers was $133,080 in May 2024. Nearshore development teams — working in the same time zone and language — can cut that cost by roughly two-thirds while avoiding the coordination friction that typically erodes offshore savings.
Model the same project at U.S. in-house rates versus a nearshore model. The difference in payback period and Year-1 ROI often shifts breakeven by 6–12 months. Founders Workshop's nearshore Latin American teams, for example, operate at approximately one-third the cost of a fully domestic U.S. build.
Scalability and Long-Term Flexibility
Software that needs re-architecting at year three has its ROI destroyed by unexpected capital outflows. In the multi-year model, include a "re-architecture risk" line in the conservative scenario — assign a probability-weighted cost to the risk of a major rebuild within five years if the team didn't prioritize scalability from the start.
This is where upfront architecture decisions made during Definition and Discovery phases have direct long-term financial consequences.
Common Mistakes That Skew Custom Software ROI Calculations
Underestimating Total Cost of Ownership
Most businesses calculate ROI using only the initial development invoice. This systematically understates the five-year cost picture. Maintenance, change management, training, and security compliance are recurring costs that compound year over year. Omitting them produces an ROI that looks strong in the proposal but collapses under post-launch scrutiny.
Skipping the Pre-Implementation Baseline
Without documented current-state metrics, there's no way to prove what the software actually changed. Organizations that skip baselines can't defend ROI claims to boards or investors post-implementation. That's both a governance failure and a business problem.
Modeling Hard ROI While Ignoring Adoption Risk
Even solid financial projections fail when adoption goes unmodeled. Projects with strong paper ROI routinely underperform because user behavior was never factored in.
Soft benefits like usability and employee satisfaction have measurable financial proxies that belong in every ROI model:
- Training costs that spike when interfaces are poorly designed
- Turnover impact tied to tool frustration and productivity loss
- Error rates that rise when workflows don't match how teams actually work
Apply adoption rate as a discount factor across all projected benefit figures in conservative scenarios.
When Does Custom Enterprise Software Deliver Strong ROI?
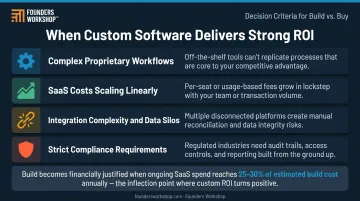
Custom software ROI is strongest when at least one of these conditions applies:
- Complex, proprietary workflows that off-the-shelf tools can't support without costly workarounds
- SaaS costs scaling linearly with headcount or usage, approaching the three-year cost of a custom build
- Integration complexity creating data silos and manual reconciliation that drain time and accuracy (the 2025 MuleSoft Connectivity Benchmark Report found 90% of organizations report business obstacles caused by data silos)
- Strict compliance requirements (HIPAA, SOC 2, PCI DSS) where generic platforms introduce regulatory risk
That said, none of these conditions guarantees a strong return. For standard back-office functions — HR onboarding, basic CRM, expense reporting — proven commercial platforms exist precisely because the workflows are generic. Building custom in those areas rarely pays off.
The build vs. buy inflection point: When annual SaaS subscription costs, integration overhead, and manual workarounds approach 25–30% of a custom build estimate, the ROI case for custom development typically becomes compelling within a three-year window.
Before any development commitment, Founders Workshop runs a Discovery phase where a dedicated Project Champion models total costs and expected returns alongside the client — so the build vs. buy decision is grounded in numbers, not assumptions.
Frequently Asked Questions
How much does it cost to build custom enterprise software?
Costs range from roughly $25,000 for simpler tools to $350,000 or more for full enterprise platforms, depending on complexity, team structure, and integration requirements. What matters for ROI purposes is total cost of ownership over three to five years, not just the initial build fee.
What ROI can I expect from custom enterprise software?
Year-1 ROI is often negative or near zero due to build and adoption costs. Multi-year returns are where value accumulates — driven primarily by automation savings, license elimination, and revenue uplift. The exact range depends heavily on process automation scope and adoption rates.
What's a good payback period benchmark for custom enterprise software?
Payback periods vary by project scope and adoption speed. A well-architected project with high automation scope and strong adoption typically reaches positive ROI within two to three years. MVP-first and phased delivery approaches can accelerate that timeline by generating returns before the full platform is complete.
How long does it take to see ROI from custom enterprise software?
The typical arc: Year 1 is a net investment, Year 2 approaches break-even as adoption matures, and Year 3 onward is where positive returns compound. Phased rollouts that deploy high-ROI features first — a core principle in Founders Workshop's 5D Discovery phase — can move that break-even point earlier.
What costs should I include when calculating ROI?
Include all four TCO categories: build costs (engineering, design, QA), operating costs (hosting, licenses, support), enablement (training, change management), and governance and security (audits, compliance). Maintenance alone is one of the most underestimated recurring costs in enterprise software budgets.
What's the difference between hard ROI and soft ROI in software projects?
Hard ROI is measurable financial impact: labor savings, license elimination, faster revenue cycles. Soft ROI is qualitative improvement: employee satisfaction, decision speed, competitive positioning. Both belong in a complete model. Soft ROI should be translated into proxy financial metrics — reduced turnover cost as a proxy for improved satisfaction, for example — rather than left as narrative claims.